
A Beginner's Guide to Data Analytics
In an age where the collection and storage of data is more prevalent than ever, understanding how best to analyze and extract information from this data is the key to success for many businesses and organizations.
Enter data analytics – a field that is expanding rapidly and provides careers with enormous growth potential.
But you may have many questions about the field, such as: what exactly is data analytics, anyway? And: how do I become a data analyst?
We’ll answer these questions and more in this data analytics guide for beginners.
Below is a breakdown of what we’re going to cover in this article.
- What is Data?
- What is Analytics?
- What is Data Analytics?
- The Data Analytics Process
- Types of Data Analytics
- How Do I Become a Data Analyst?
- What Skills Do I Need to Become a Data Analyst?
- Popular Careers That Rely on Data Analytics
- FAQs
- Why You Should Learn Data Analytics
- Data Analytics is the Future
What is Data?
In its simplest form, data is just information and is found everywhere.
Every time we open an app, buy something at the supermarket, answer a survey, or fill out a CAPTCHA to log into our email—we’re creating data that is collected by businesses and organizations. Everything that companies and consumers do online and even offline creates information.
This information can be incredibly specific—including demographic data, behavioral information, and other personal details—or can relate to larger groups as an aggregate. This new massive stream of information has led to the creation of the field of big data, which focuses on datasets (groupings of information).
Data by itself doesn’t reveal much, especially when viewed without context or method. To really understand what the data is saying, there must be a method to clean it, organize it, and interpret it better, and this is where analytics comes into the picture.
What is Analytics?
Analytics is the way we turn thousands of data points into meaningful insights that can be applied to business processes. It helps find patterns in data that can highlight areas for improvement, successful tactics, and even show potential trends for the future.
Data needs to be properly interpreted and organized to be useful, a process that includes removing data that isn’t useful (scrubbing the data), organizing it into more logical groupings, and connecting data points to find useful information.
For most businesses, collecting data happens throughout several points in their production and value chains. Retailers, for example, collect data from suppliers, their own warehouses, points of sale, customer surveys, and even online visitors to their websites.
All this information provides different insights and can be used for a variety of reasons including better marketing strategies, tailored promotions, value chain improvements, and operational fixes.
What is Data Analytics?
At a high level, data analytics is the process of collecting, organizing, and interpreting groups of information or data points to discover trends and areas of opportunity, and then create actionable insights.
With data analytics, businesses are able to answer the following questions: what happened in the past? What’s happening now? What might happen in the future?
"In this world of big data, basic data literacy—the ability to analyze, interpret, and even question data—is an increasingly valuable skill," says Harvard Business School Professor Janice Hammond in the HBS Online course Business Analytics.
Data Literacy
Data literacy is the ability to read, understand, and utilize data in different ways. Being data-literate can help non-data professionals read and understand data, and use it to inform their decision-making.
There’s now an increased demand for data-literate business professionals who can handle, analyze, and interpret data to drive decision-making.
Data Ecosystem & Lifecycle
The term data ecosystem refers to the programming languages, packages, algorithms, cloud-computing services, and general infrastructure an organization uses to collect, store, analyze, and leverage data.
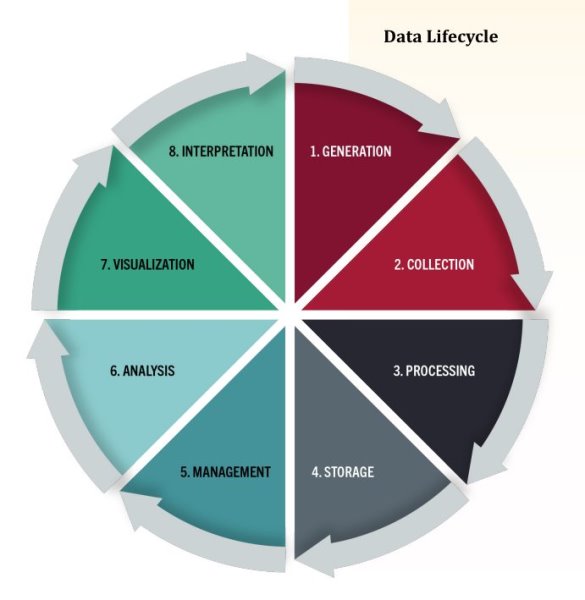
No two organizations leverage the same data in the same way. As such, each organization has a unique data ecosystem. While the data ecosystem encompasses everything that handles, organizes, and processes data, the data life cycle describes the path data takes from when it’s first generated to when it’s interpreted into actionable insights.
This life cycle can be split into eight steps: generation, collection, processing, storage, management, analysis, visualization, and interpretation.
A data project’s steps are often described as a cycle because the lessons learned and insights gleaned from one project typically inform the next. In this way, the final step of the process feeds back into the first, enabling you to start again with new goals and learnings.
The Data Analytics Process
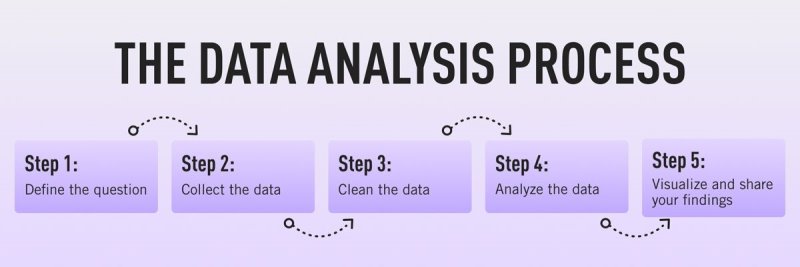
Here’s an introduction to the data analytics process:
Step 1: Define the question
Define the question or goal behind the analytics.
To start, as a data analyst, you may ask: what business problem am I trying to solve? Defining this can set the framework for the entire analytics.
Step 2: Collect the data
Collect the right data to help answer this question.
You’ll need to determine what kind of data you’ll need: quantitative (numeric) data such as sales figures, or qualitative (descriptive) data, which may include customer surveys.
Step 3: Clean the data
So, the data has been collected. Now what? It’s time to clean!
Perform data cleaning/data wrangling to improve data quality and prepare it for analysis and interpretation–getting data into the right format, getting rid of unnecessary data, correcting spelling mistakes, etc.
Step 4: Analyze the data
Analysis is ultimately about retrieving the information contained in data.
Analyze and interpret the data using statistical tools (i.e. finding correlations, trends, outliers, etc.).
Step 5: Visualize and share your findings
Present this data in meaningful ways: graphs, visualizations, charts, tables, etc. Data analysts may report their findings to project managers, department heads, and senior-level business executives to help them make decisions and spot patterns and trends.
At this stage of the process, it’s important that you are as clear and transparent in your findings as possible so that the relevant stakeholders can make informed decisions.
Types of Data Analytics
When analyzing data, there are different methods of extracting the information you need in order to draw out insights, patterns, and trends which guide business decisions.

a. Descriptive analytics: What happened?
This type of analytics purely describes what has happened. The goal of descriptive analytics is to summarize data in a meaningful and descriptive manner, not to make any predictions.
Examples include monthly revenue reports and KPI dashboards.
b. Exploratory analytics: What are the pattern and trends?
Exploratory analytics dives a bit deeper than descriptive analytics, skimming for detectable patterns and trends in data. Another way to think of this is the initial investigation phase.
c. Diagnostic analytics: Why did it happen?
Takes the insights found from both descriptive and exploratory analytics and investigates further to find the causes.
The point of difference between descriptive and diagnostic analytics is that while descriptive analytics seeks to give an objective overview of what has happened, diagnostic analytics seeks to establish why those things may have happened.
d. Predictive analytics: What is likely to happen in the future?
Predictive analytics makes use of past patterns and trends in data in order to estimate the likelihood of a future outcome or event. This type is often used more by data scientists, rather than data analysts. It uses data, statistics, and machine learning algorithms and techniques to figure out the likelihood of future outcomes based on data.
Examples include sales forecasting and risk assessment.
e. Prescriptive analytics: What is the best course of action?
Now that we’ve found out what happened, why it happened, and what may happen in the future, what should be done next?
It takes insights found from all types of data analytics (descriptive, exploratory, diagnostic, predictive) to determine the best course of action.
How Do I Become a Data Analyst?
Traditionally, most entry-level data analyst jobs have required at least a Bachelor’s degree, but that is changing quickly. We’re now seeing a shift where employers are looking for proven skills and experience with industry tools.
The right hard and soft skills are even more important than a degree when it comes to landing a role in data analytics today. It allows aspiring data analysts a chance to build job-ready skills and get the experience they need to start working on real-world projects.
Here are some practical steps you can take:
Complete a data analytics boot camp or program
Especially if you’re thinking about entering the field with little to no experience, taking a dedicated data analytics boot camp is the best way to cover all of the basic skills and knowledge needed to become a data analyst.
Write a dedicated resume
If you’re looking to change careers into data analytics, you’ll need to re-write your resume to highlight the new skills you’ve acquired during the course of your data analytics program—or any other skills from previous roles that may be relevant!
Create a solid data analytics portfolio
Employers want to see your skills and experience exemplified in previous projects, which is why most career-changers will have also built up a data analytics portfolio.
Consider including projects you completed on your own as well as projects you completed as part of a team; projects using different programming languages; projects that run using different methods of analysis; projects using visualizations and clearly-written explanations of your findings.
Do your research, network, and apply for jobs
The field of data analytics is wide-ranging, and the roles you’ll find online won’t all come under the same name. Once you’ve narrowed down the list of companies and organizations you may be interested in, networking is key. This can be done by attending career fairs, getting in contact with recruiters, or reaching out to people on LinkedIn.
Finally, take the plunge and start applying for jobs! Make sure that you tailor your cover letter to each individual job posting you’re interested in.
What Skills Do I Need to Become a Data Analyst?
Entering into the data space as a beginner may seem daunting, but with foundational knowledge, you can build your data literacy and leverage the power of data for organizational success.
There are a few standard hard and soft skills that every data analyst entering the field will need. This list is by no means exhaustive, but see this as a starting point if you’re considering a career change.

Hard skills needed to become a data analyst
- ● Programming languages, like Python and R, are commonly used to solve complex statistical problems with the data. Proficiency in a database querying language, like SQL, can also help you more easily extract and change data in a database.
- ● Visualization tools like Tableau are great for presenting seemingly complex datasets in a more intuitive way, such as charts, graphs, and maps. Other examples include Microsoft Excel and Power BI, Google Charts, Zoho Analytics, Data Wrapper, and Infogram.
- ● Data Wrangling - Data wrangling is the process of cleaning raw data in preparation for analytics. It involves identifying and resolving mistakes, filling in missing data, and organizing and transferring it into an easily understandable format.
- ● Mathematical Ability and statistical skills - You don’t have to be a mathematician to become data literate, but strong math skills become increasingly important as you deal with more complex analyses. A seasoned data professional needs a solid understanding of statistics, probability, linear algebra, and multivariable calculus.
Soft skills required to become a data analyst
Soft skills are non-technical skills that describe how you work and interact with others. They include any skill that can be classified as a personality trait or habit.
- ● Critical thinking
- ● An eye for detail
- ● A methodical and logical approach
- ● A problem-solving mindset
- ● Great collaboration and communication skills
Popular Careers That Rely on Data Analytics
One really cool thing about gaining data analytics skills is that they don’t lock you into a single career.
Businesses in nearly every industry use data analytics to power decisions, gain a competitive advantage, boost sales, win new customers, improve internal operations, maximize profits, etc. This makes data analytics skills useful in many roles.
Here are some practical steps you can take:
1. Data Analyst
The basics of data analytics involve retrieving and gathering large volumes of data, organizing it, and turning it into insights businesses can use to make better decisions and reach conclusions. To share their findings with business decision-makers, an analyst (or data visualization specialist) may create charts, graphs, etc. In short: they take worthless data and produce meaningful, actionable results.
2. Business Analyst
They identify meaningful patterns in data to drive business decisions, working closely with business VPs and senior managers. Their duties may involve predictions, optimizations, risk management, and so forth.
3. Product Manager
Product managers own and guide the success of products from conception to launch. Each stage requires data analytics! You must analyze the market for trends and problems to solve, leverage data to determine how to improve the features, and figure out how to make the product even better in subsequent versions.
4. Marketing Analyst
Market research analysts are often responsible for collecting and analyzing market data using platforms like Google Analytics and BuzzSumo.
As more companies go digital, the demand for digital marketing would surely follow. Digital marketers must understand consumer habits/motivations, detect changing trends, and track performance in order to improve ads, social media campaigns, and SEO strategies.
5. Quantitative Analyst
Quantitative analysts ("quants") are data analyst professionals who work in the financial industry, leveraging data and data models to manage risk, predict changes in the valuation of stock and bonds, and make data-driven investment decisions.
FAQs
Is data analysis the same as data analytics?
The terms "data analysis" and "data analytics" are often used interchangeably, but there is a small distinction.
Data analytics is a term usually used to refer to the broad field of using data to make business decisions — it’s a term referring to a discipline.
Data analysis, meanwhile, is a subset of data analytics and is a term used to describe the process of gleaning insights from data. That said, data analyst jobs tend to fall under both umbrellas.
Why is data analytics important?
Data analytics is important because, without it, companies would be facing mountains of data with no way to make any sense of it. It helps businesses improve and optimize based on the past. This leads to better profits, more customers, a reduction in errors, more efficient practices, etc.
Do data analysts need to code?
Some data analysts do have to code as part of their day-to-day work, but coding skills are not typically required for jobs in data analytics. That said, while basic data analytics functions can be performed without writing code — interpreting Google Analytics data, for example — the rise of big data has added a layer of technical difficulty to the Data Analyst’s role, which means coding is now much more likely to come up and having those technical skills will certainly be valued if you do want to become a Data Analyst.
Most companies heavily rely on performing scalable analytics using essential coding languages like R, Python, SQL, and BI tools.
Is data analytics hard?
Well, the great thing about data analytics is that it’s more of an entry-level role, meaning you can jump right in with basic knowledge after you take some data analytics courses for beginners and sharpen a few key skills. (Of course, it certainly won’t hurt if you already have experience with coding, math, or statistics!)
Becoming a data analyst can also open the door to lucrative careers like data science and data engineering (just to name a few) as you gain more experience on the job.
Why You Should Learn Data Analytics
So, why is it a great idea to learn data analytics and pursue a career in this field?
1. There is anticipated job growth for data professionals.
The anticipated job growth for market research analysts (another term for data analysts) between 2020-2030 is 25%, based on data from the Bureau of Labor Statistics. That’s a significant amount of new positions being created.
2. Data analytics is in demand.
There is a demand for people who can use the data to perform reporting and analysis, thus helping businesses and organizations make important and critical decisions.
3. Data roles have higher than average salaries.
According to Payscale, entry-level data analysts will receive an annual salary between $40,000 – $73,000 (an average of $57,000). Senior data analysts can bump that up as high as $83,000.
4. Universal need (all kinds of companies require data help).
Every business generates data. But its value depends on your ability to process, manipulate, and ultimately translate that data into useful insights.
Data Analytics is the Future
Pursuing a career as a data analyst is a great choice if you're willing to keep learning and challenging yourself. Today’s companies are being flooded with data, and they desperately need data analysts capable of making sense of it for them. As the Internet of Things comes into its own, those needs will only multiply.
If you’re unsure about which direction to take in tech, it’s a good idea to learn data analytics as a starting point. Large global companies are already appointing Chief Data Officers (CDOs), showing the extent to which they’re taking data management seriously.
Someone who starts pursuing a data career today could be in a very lucrative position in very little time.
Still, if you wonder if Data Analytics would be right for you, do not shy away to explore a data analyst career and see if it suits you well.